Blog
-
2 minutes
read
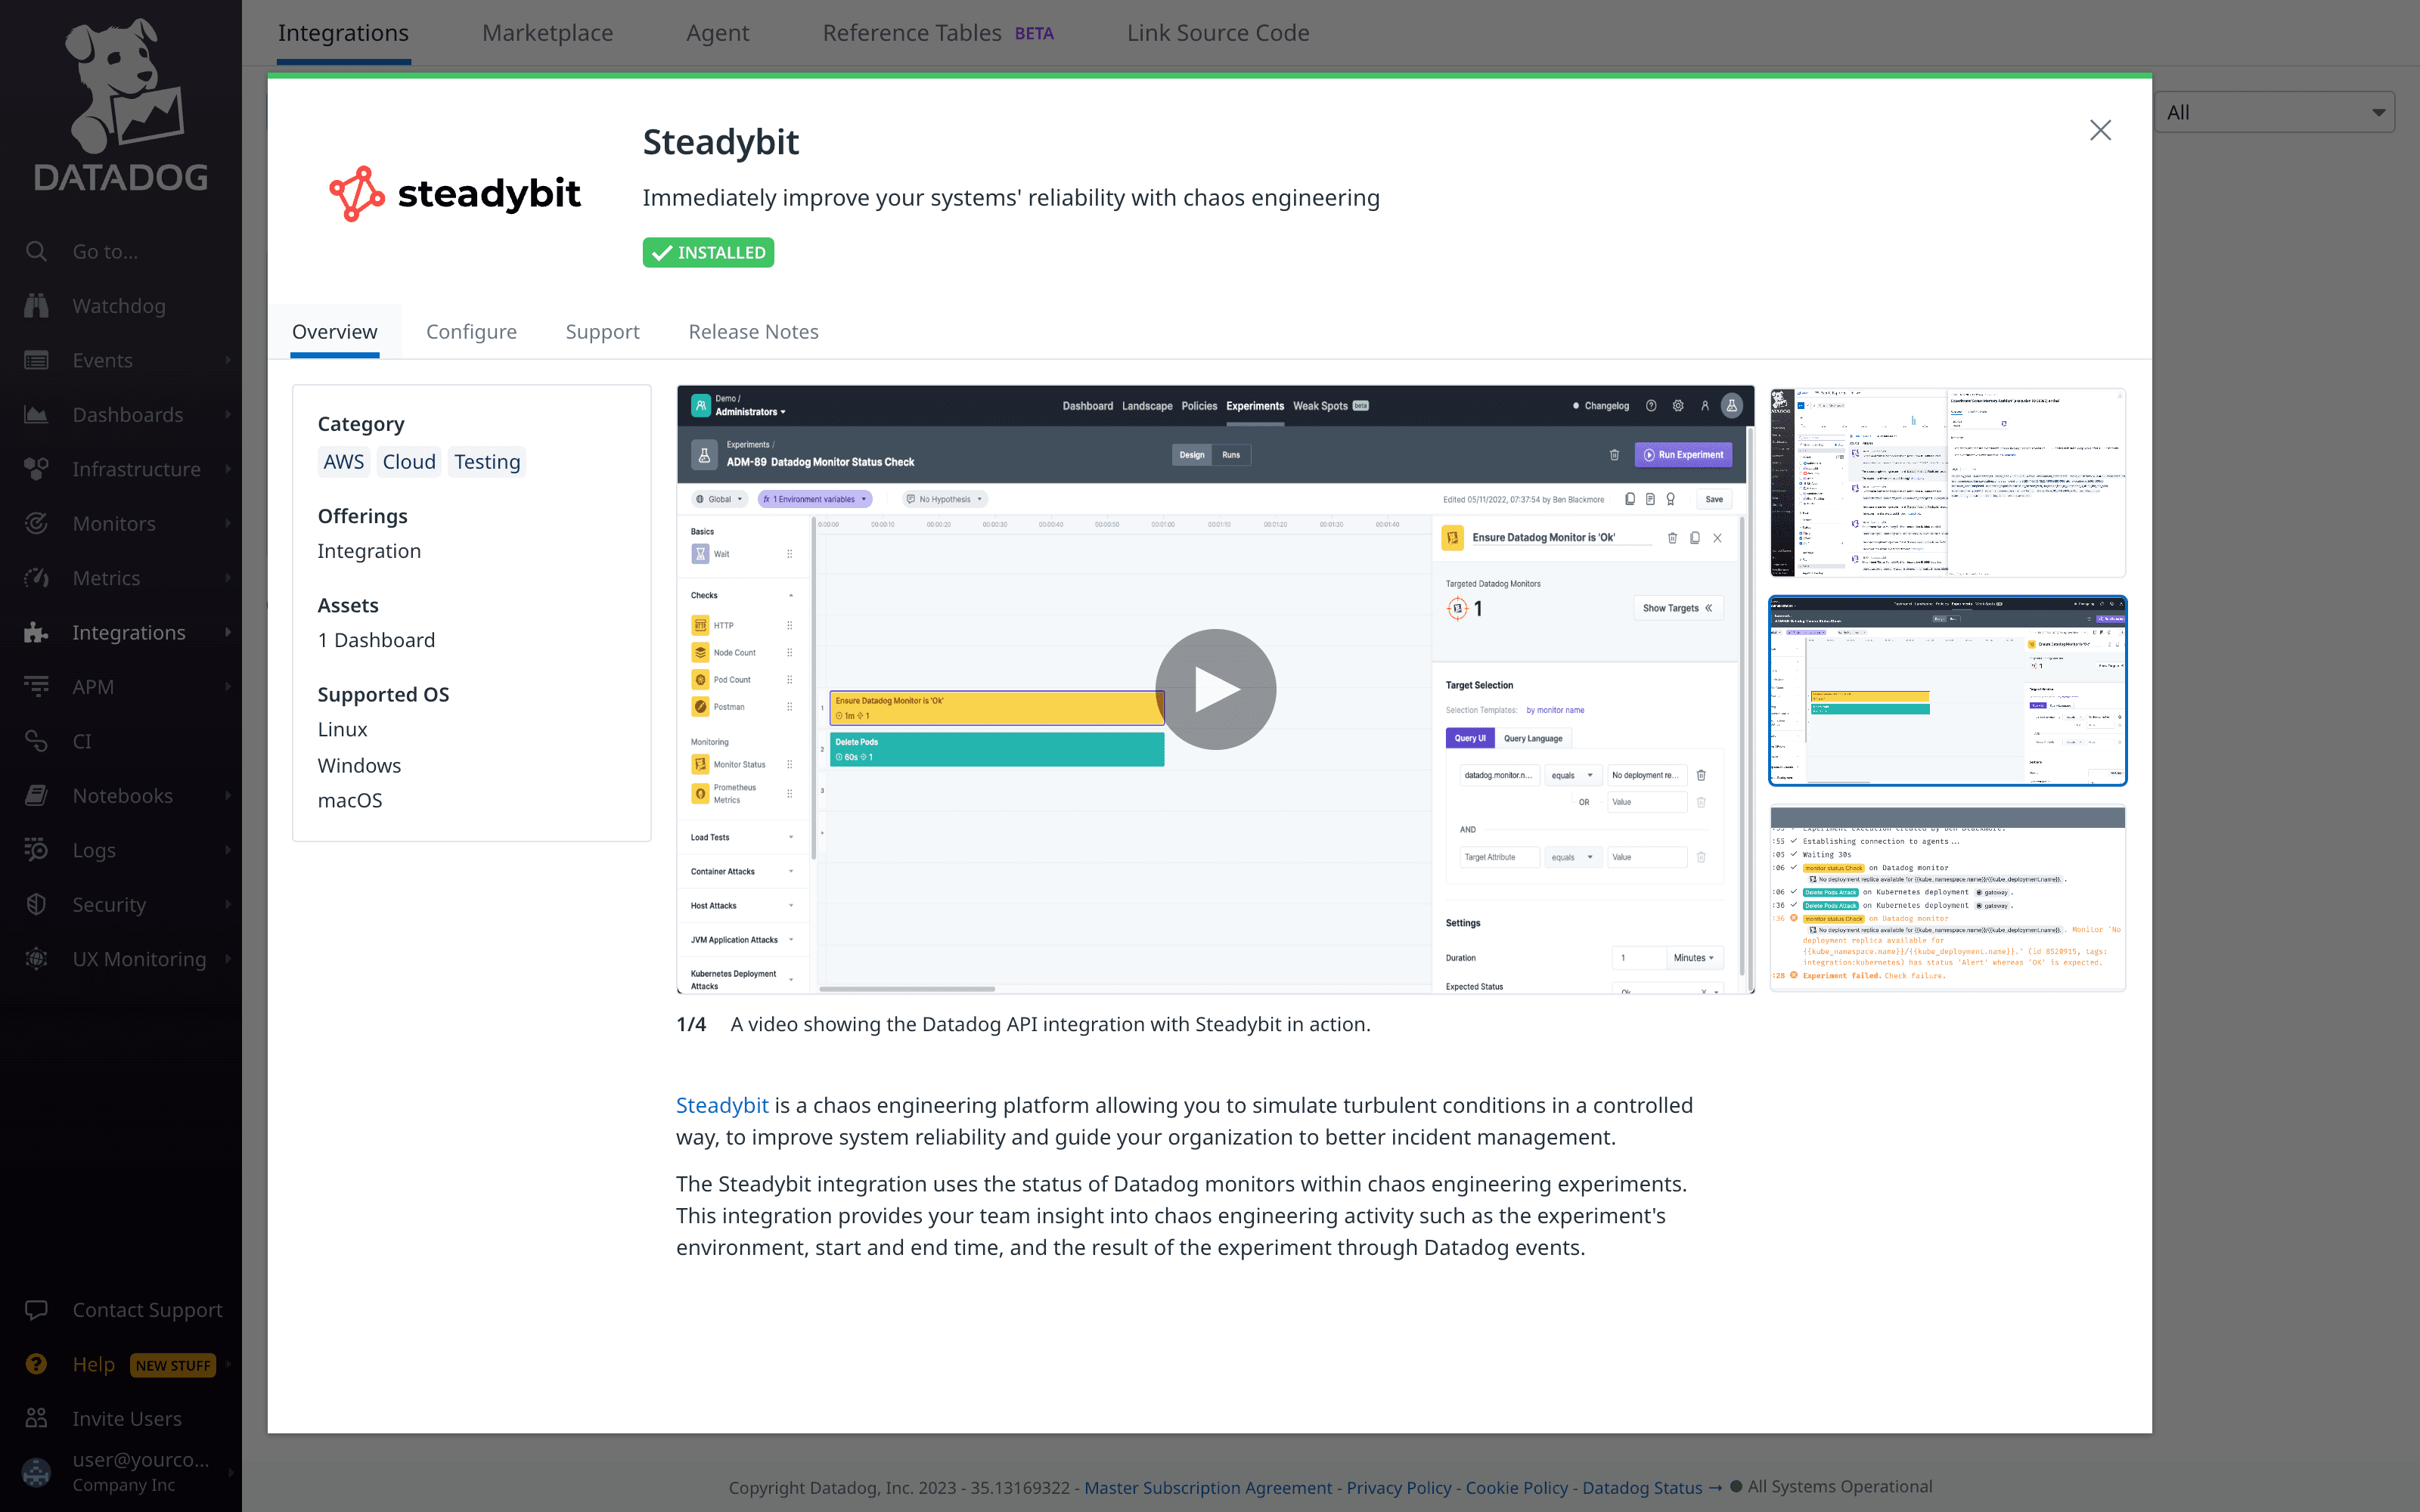
We have released our integration into Datadog recently. Within Datadog, the Steadybit integration is now available and can be installed. The integration includes a ready-to-go dashboard. Steadybit experiment events can also be inspected in the Datadog event views.
We are excited to announce that the Steadybit integration in the Datadog product is now available for everybody. Inside your Datadog tenant, you will find Steadybit as an integration on the corresponding view. The Integration will provide a quick overview of what you get and how you configure everything.

Built in dashboard
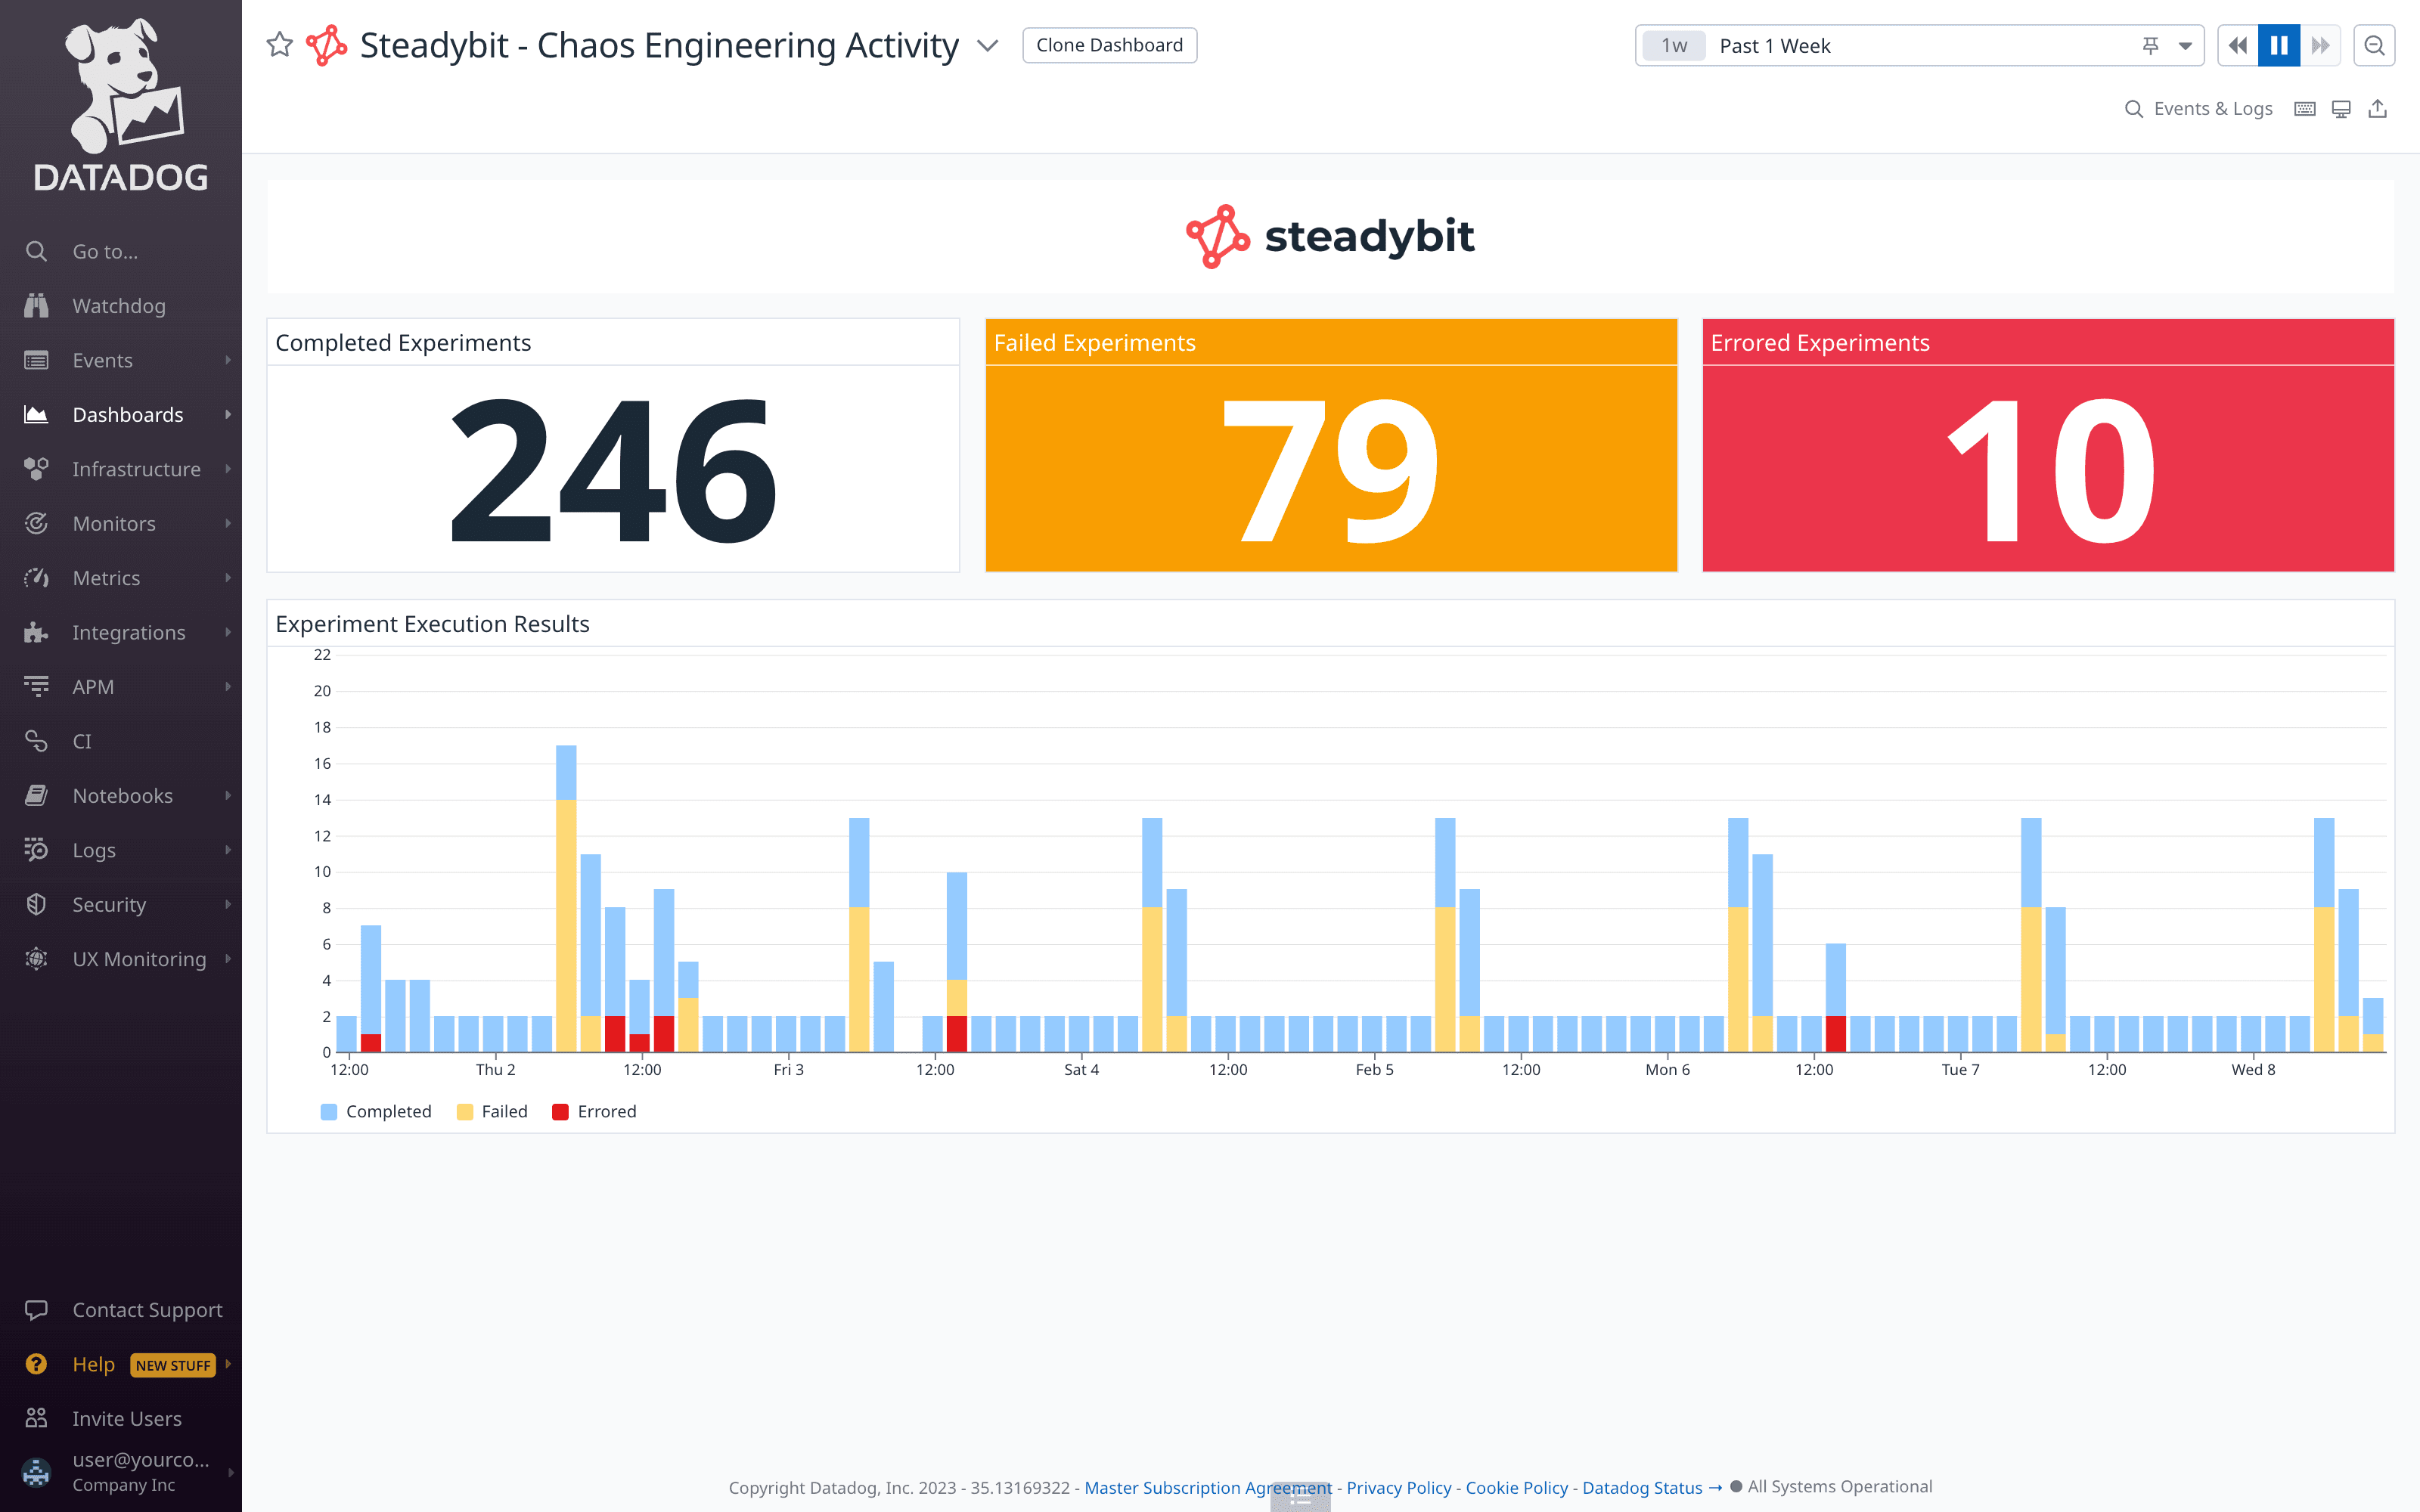
When installed, the integration serves you with a dashboard that shows statistics about Steadybit experiments. Statistics are split into completed, failed and errored states. The dashboard information can also give your overall company an overview and make them aware of your chaos-engineering experiments.

Events
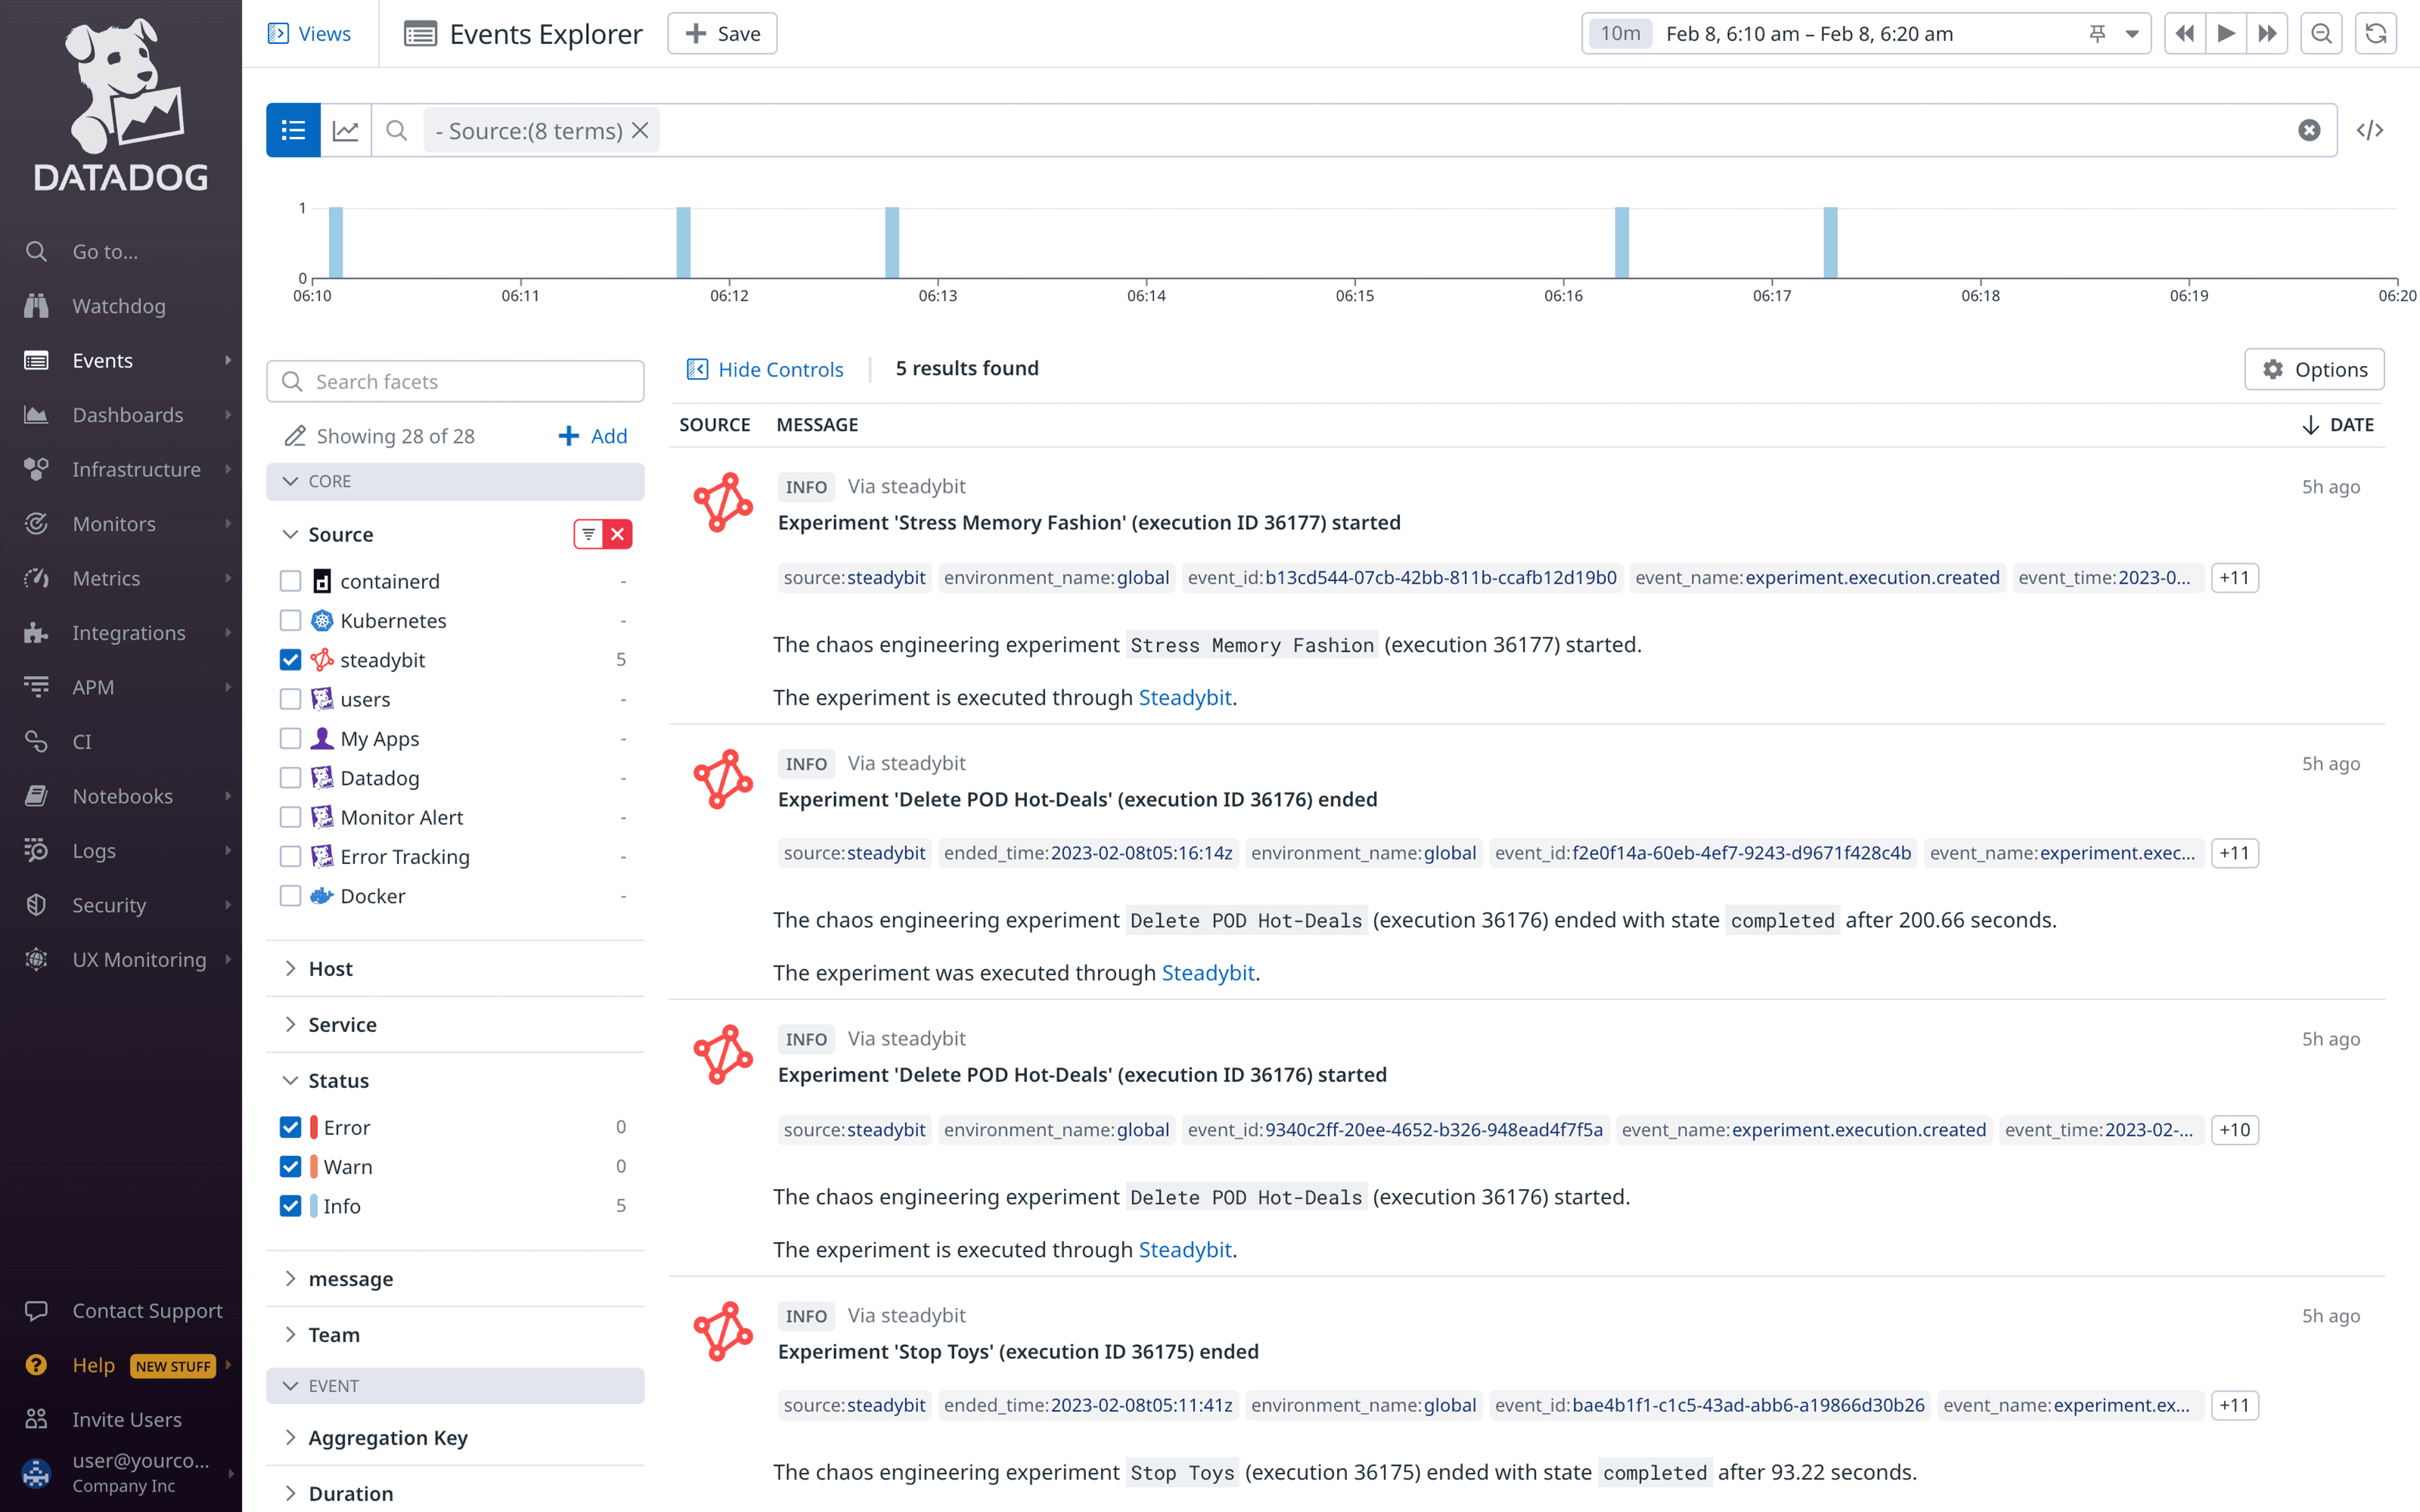
Events are collected and aggregated as metric values in the built-in dashboard. If you want to inspect them individually, the Datadog event view will also now list each single event with a summary, useful tags a link to jump into the Steadybit platform to see the experiment execution.


